

Introduction
Now that the World Series is over, the most interesting part of the baseball season starts: The Hot Stove League. To provide some background for this, key financial statistics of Major League Baseball (MLB) are set forth below.
Income
Consider first the two major sources of income: TV contracts and ticket sales.
a. TV Contracts
According to various sources, ESPN is paying MLB $5.6 billion for the 2014-2021 period or $700 million per year. Fox is paying MLB $5.1 billion for the 2014-2022 period or $567 million per year. Facebook paid MLB $30 million for 25 games in 2019. That means MLB got paid a total of $1.3 billion or $43 million per team.
As noted in Table 1, local TV deals far exceed the value of national TV deals to each team. The table also highlights the huge local TV contracts of the two Los Angeles teams and the New York Yankees.
In MLB, 48% of local revenues are subject to revenue sharing and are distributed equally among all 30 teams, with each team receiving 3.3% of the total sum generated. As Table 1 suggests, this significantly reduces the differences in teams’ TV incomes.
Table 1. – TV Contract Revenue by Team (mil. US$)
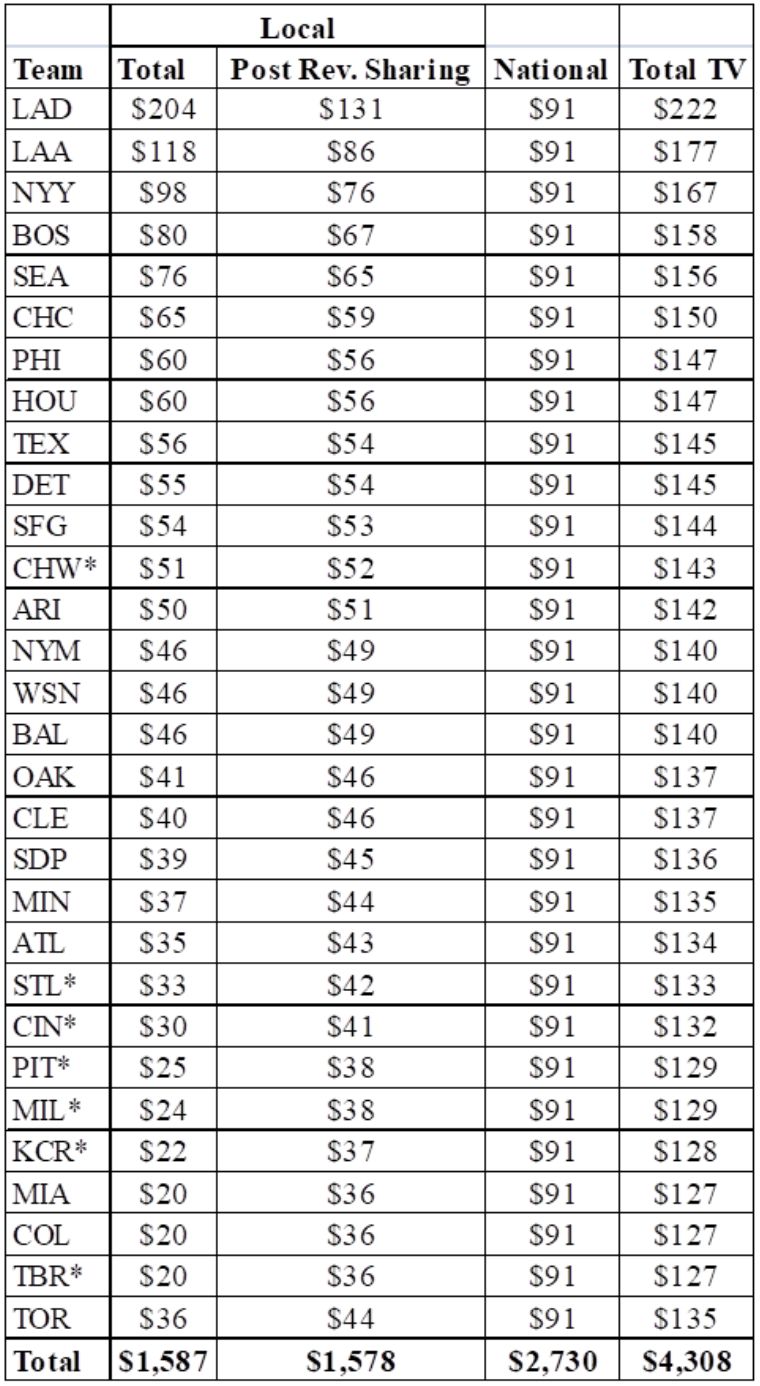
* 2016 payment; 2019 payment larger
Source: Fangraphs
b. Ticket Sales
Data on attendance by team and revenues are presented in Table 2. Noteworthy are the high attendance rates of the Red Sox, Cardinals and Cubs. Revenues are estimated by using the average price per seat for all MLB teams in 2019. The Dodgers, Yankees and Toronto benefit from having the largest stadiums. Boston revenues are limited by the size of its stadium.
Table 2. – MLB Attendance and Revenues
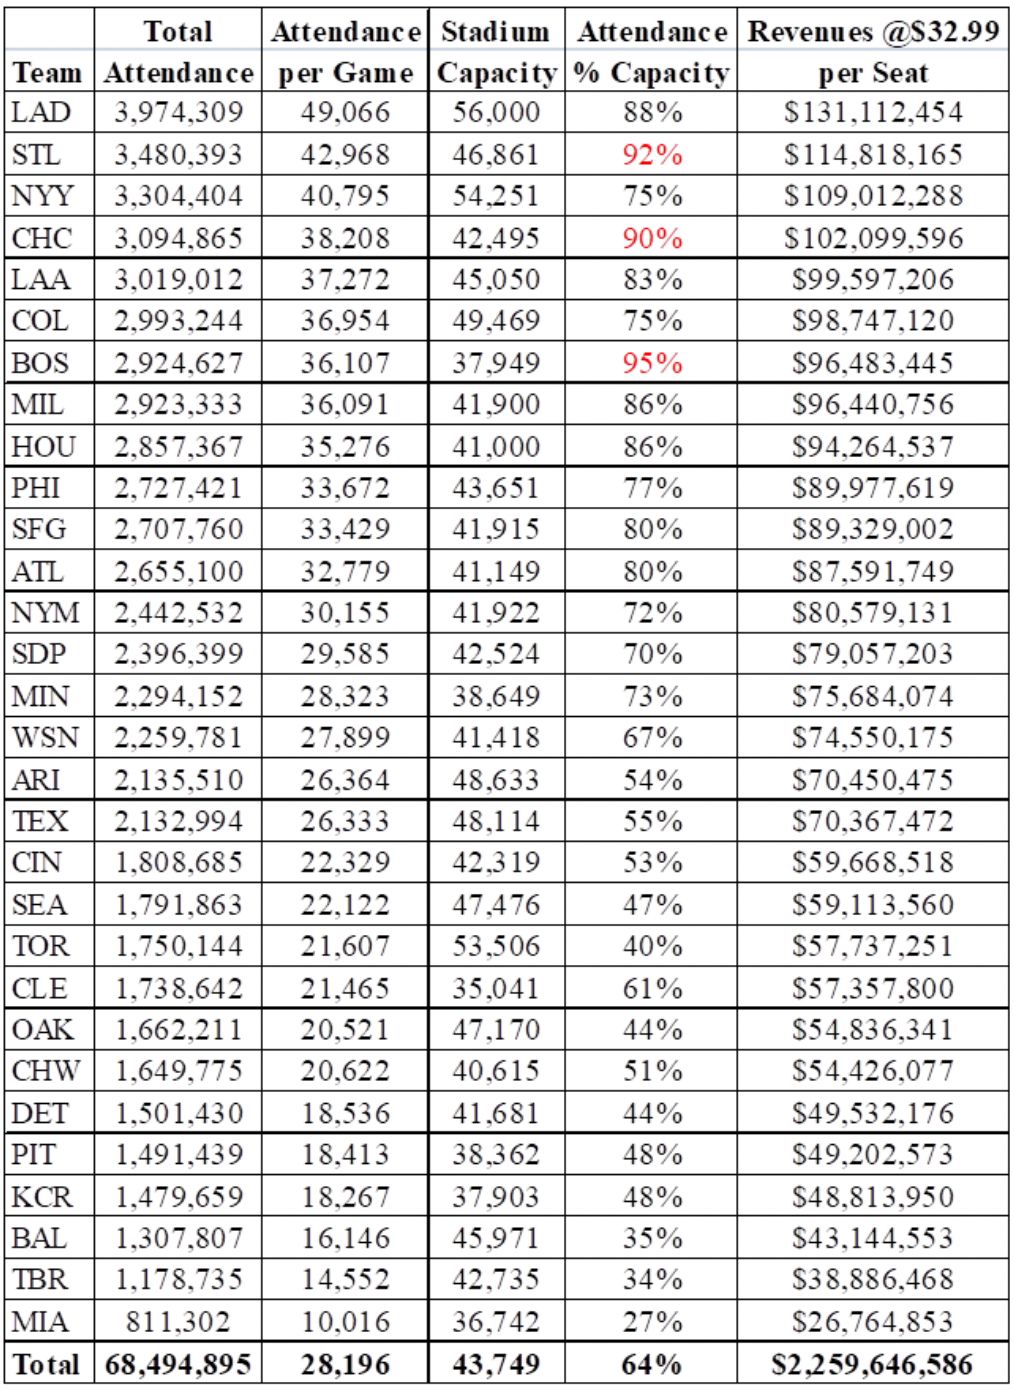
Source: Statista and Baseball Reference
Expenditures
a. Agents
Agents play a major role in determining MLB expenditures. And a number of them do quite well. According to Forbes, Scott Boras is the United States’ most powerful agent with more than $2.3 billion in current MLB contracts under management. Boras, a lawyer by trade, also runs the Boras Corporation, the world’s leading baseball representation agency.
Table 3. – Leading Baseball Agents, 2019

Source: Baseball Reference
b. Payrolls
Table 4 provides the payrolls for the MLB teams. The numbers include active, injured and reserve players. A club exceeding the Competitive Balance Tax threshold (Luxury Tax) for the first time must pay a 20% tax on all overages. A club exceeding the threshold for a second consecutive season will see that figure rise to 30%, and three or more straight seasons of exceeding the threshold comes with a 50% luxury tax. Right now, Houston and the Red Sox are over the threshold by $15 million and $11 million respectively. Red Sox ownership says their aim is to get under the luxury tax threshold ASAP.
Table 4. – MLB Payrolls, 2019 (mil. US$)
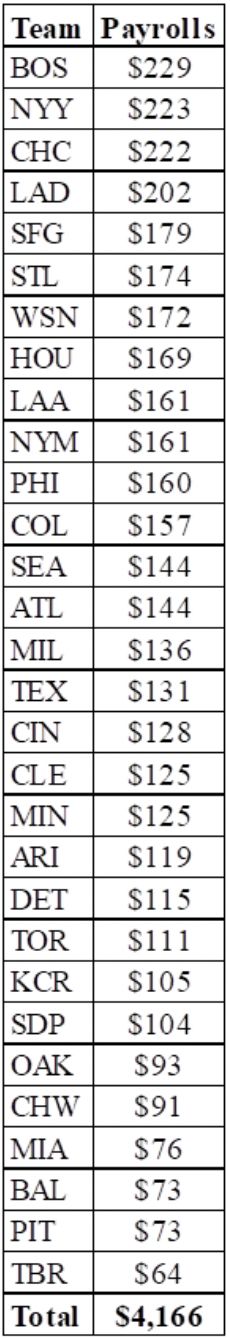
Source: Spotrac
c. Largest Contracts
Table 5 provides data on the largest guaranteed contracts. There can be little question that many of these will not work out for the teams.
Table 5. – Largest Contract Guarantees Going Forward (mil. $)

Source: Baseball Reference
Table 6 indicates what the players in Table 5 will be making in the last year of their contracts along with their ages. Many teams will get very little for their commitments in this last year. A good example might be Chris Davis who batted .179 in 2019 and will continue to get $23 million for each of the next three years.
Table 6. – Players’ Ages in Last Years of Contract (mil. US$)

Source: Baseball Reference
c. Team Commitments
Table 7 provides data on MLB guaranteed contracts by team going forward. They total $10 billion plus. Miami and Pittsburgh have less than $100 million guaranteed. In contrast, the Yankees and Philadelphia have $717 million and $651 committed respectively.
Table 7. – Guaranteed Contracts by Team (mil. US$)
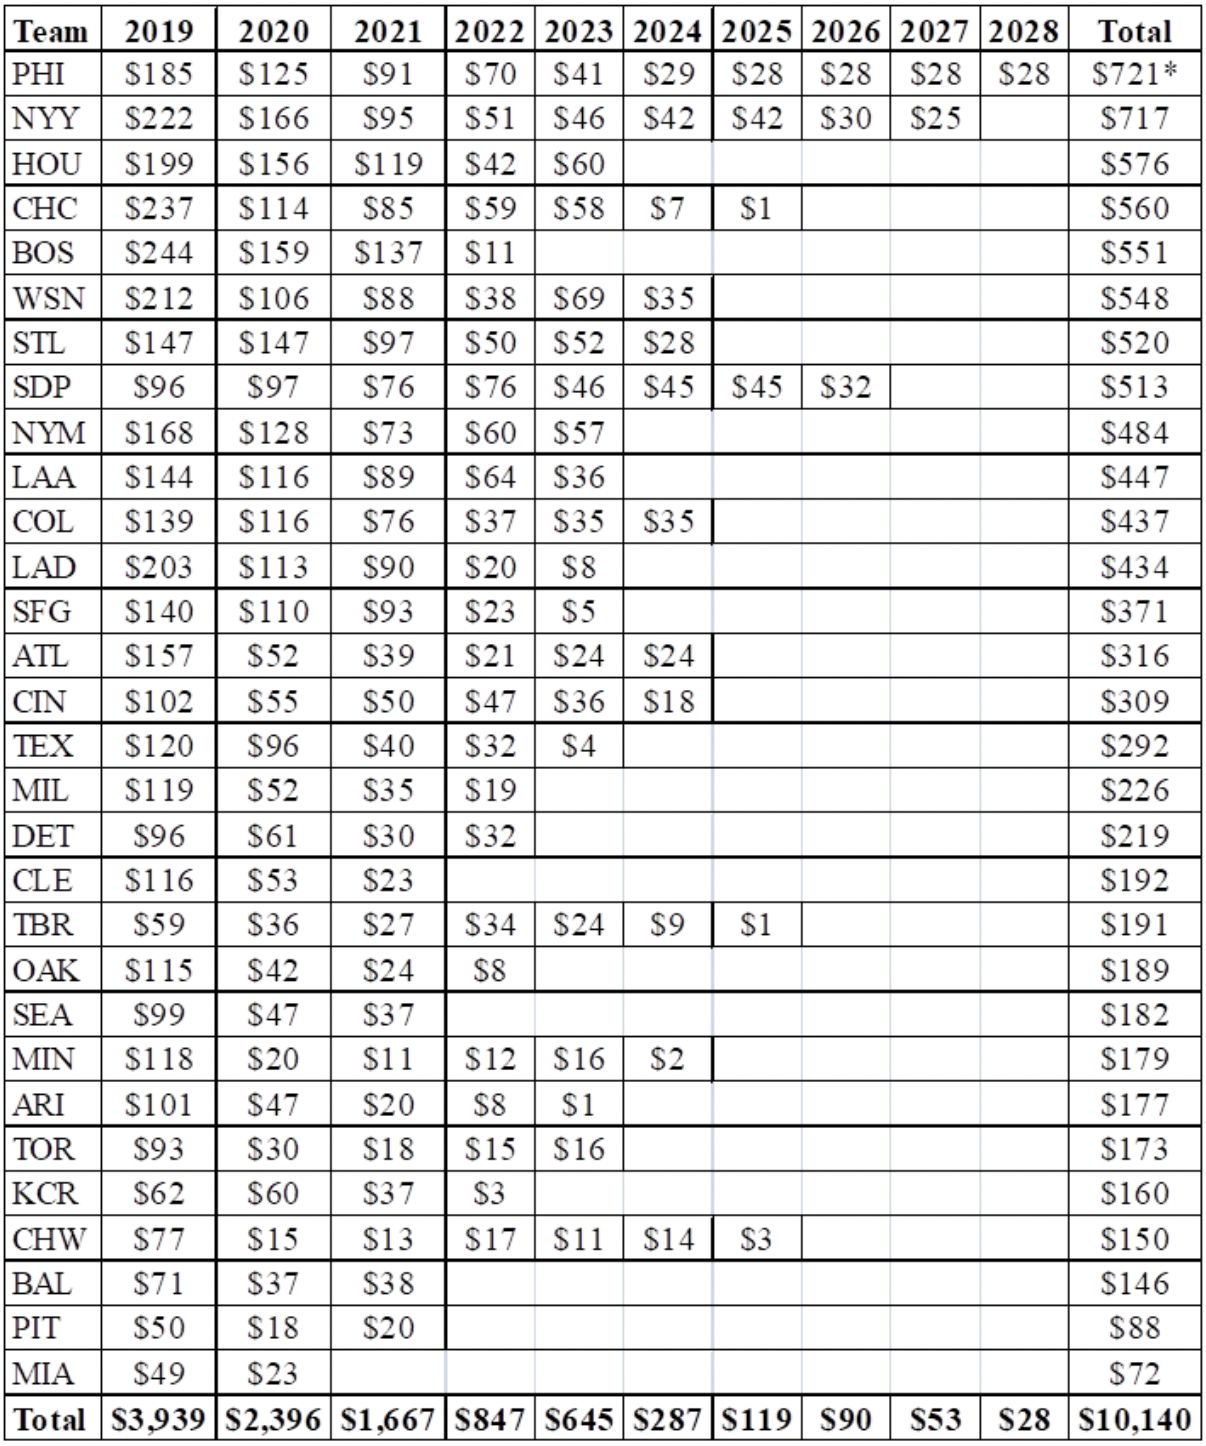
*Harper’s contract runs at $27.54 million per year through 2028 and then at $23.54 million through 2031.
Source: Baseball Reference
How the Numbers Add Up
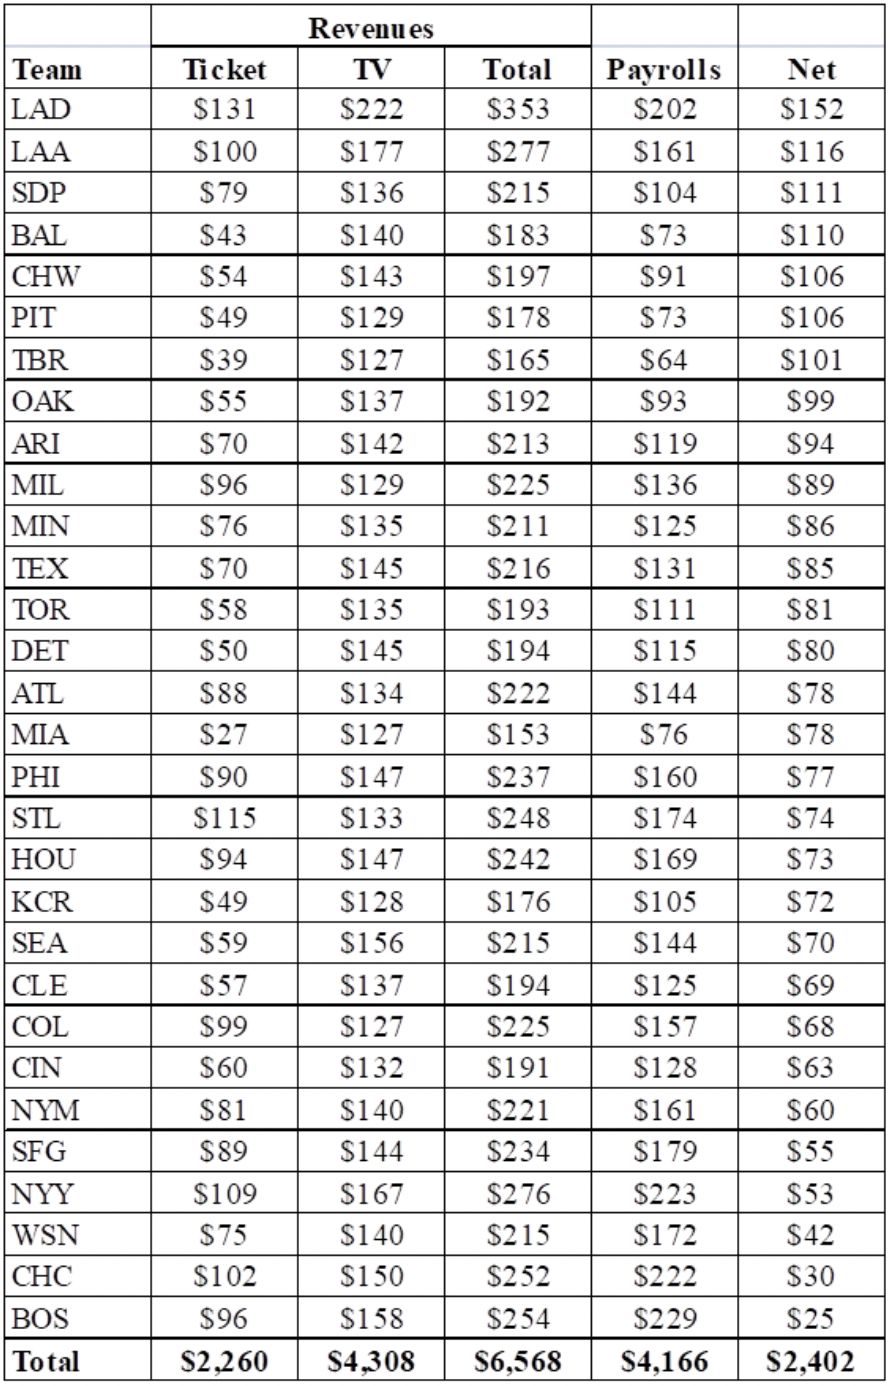
Table 8 indicates the results when receipt and expenditures are put together. It should be noted that there are significant expenditures teams must make beyond player salaries. However, only salary numbers are available. But other expenses are probably quite similar among teams.
The TV deal that the Dodgers have really stands out. In contrast, the small stadium of the Red Sox along with their large payroll makes it understandable why ownership is focused on cutting payrolls.
Table 8. – MLB Receipts and Expenditures (mil. US$)
Sources: Prior Tables
Conclusions
No doubt this year’s Hot Stove League will be interesting: many free agents and lots of money to be committed.